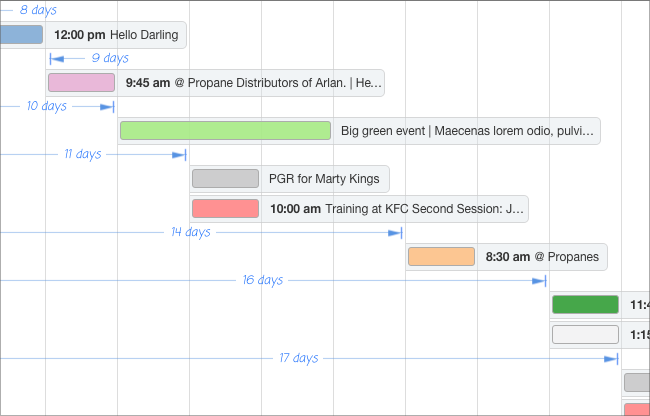
We’re close to shipping the first version of a Gantt chart for DayBack Calendar and wanted to share a preview with you; lots of folks have been asking about this. The first version should ship as an in-app update in the next few weeks.

This new view should let you look at an entire project at a glance, as opposed to just one-month or one-week at a time. And of course, it will respect your filters so you can see just one project (filtering for that project) or perhaps just one resource across multiple projects (filtering for that resource).
 We’re calling this the “horizon” view as it lets you can out past the current week or month to longer time ranges. I also like this term as opposed to “Gantt chart” since this will probably be missing a few things normally found in Gantt charts–at least in this first version. The December release won’t have dependencies, for example, or horizontal “bands” in the chart for each role or phase.
We’ll be adding some of that stuff in subsequent builds and should be able to make enhancements quickly once the main view is done, but we also recognize that “real” Gantt chart apps are too complicated for most projects–we want something that gets at the relationships between events–and lets you see everything at a glance–without lots of junk to slow you down.
Let us know if you have any feedback on the screenshot above, and stay tuned for the update!
[ba-button link=”http://www.seedcode.com/filemaker-calendar/” color=”Yellow” target=”self”] New to DayBack? Download a 30-day trial [/ba-button]


19 Comments
I know this isn’t about the GANTT but Is it possible to see the Grid in 7 days instead of 14 days ?.. would be really useful
Hi Shaun, we agree =) The horizon view can now go down to one week and the schedule views can go from 1 day to 30 days. Hope that helps! (That’s as of build 9.99. More here: http://www.seedcode.com/pmwiki/index.php?n=DayBackForFileMaker.VersionHistory )
John
the day markers under the actual events, with that be a toggle on or off, or a system setting. there will be cases where it’s not adding anythign useful to the data and therefore classes as Tufte style chart junk..??
Thanks, John. I think we’ll get a setting to toggle those into this build. Those duration lines won’t seem useful when you’re viewing daily events, but when you filter down to one project or just your important milestones, seeing how many days separate them–and then how many work days, or how many clear days (days without meetings)–gets really interesting.
I can see that for some use cases its really useful, having been an early triallist on dayback online… just for the specific cases I am currently considering minimalist zen is the way to go… thanks John
Hi,
will it be possible to make templates for projects with its different phases? This would be very usefull as most projects have more or less the same structure, but with different volumes, need of resources and time consume/span.
Good question, Svein, This probably won’t be “in” the calendar but we’ve done something very cool for this in SeedCode Complete (which will have DayBack built in as it’s calendar very soon). Here are some details of how templates work in Complete: http://www.seedcode.com/pmwiki/index.php?n=SeedCodeComplete3.MilestoneTemplates Maybe that’s an idea you can apply in your own file?
I second John’s comment regarding scheduling jobs in a production environment for given machines and days. Are the tasks draggable?
Yes =) You can drag to new days or drag their “end” to extend the duration of the event. Once there are different “bands” for each resource you’ll be able to drag to new resources as you can in the Resource and Grid views now.
Been waiting on Gantt Charts since Dayback made its debut. Looking forward to it, and the new opportunities it will bring.
Looks great….question:
Does the Gantt chart only show items with calendar dates? what about a project plan where the start and end dates of a task or milestone are not defined yet?
Oh I love this question! Right now DayBack will only show things with actual dates. But we’ve been working on views that let you sketch the relative duration of events without dates, without fixing them on the calendar. It’s a way to take a list of tasks, order them, assign “weight” or “duration” to them, and then try then in various actual times on the calendar to see where the project “fits”. This is *not* coming soon but we’re very psyched to be building it as I think this is how a lot of us actually sketch out our plans.
Thanks John,
How far out are we for the initial release?
Peter
If you’re using DayBack now, click “Account Settings” then “Check for updates”… we pushed it a few hours ago. =) The new version should also be up at http://www.seedcode.com/downloads for those new to DayBack.
Hi,
I do this with a javascript library… But is very hard. Like to see a native solution….
https://www.dropbox.com/s/qb59mma9vyf9z10/Captura%20de%20Tela%202014-05-30%20%C3%A0s%2003.10.43.png?dl=0
One of the use cases here is in production scheduling, so there may be many ‘small’ events inside one resource in a day. Ability to show these without any labels will be important, or some control of what pieces of data from the record gets put into a reduced label, as they may butt up to each other when placed in horizontal orientation.
Definite move in an direction of opportunity for us….
Makes sense, John. It will be interesting to see what we can do with the “compressed” setting down the road–that’s what I’d use in Resource/Grid view. Not sure you’ll need it in Horizon view but I’ll be looking forward to some screenshots of your schedule in the new view so we can see what we need to do. Thanks!
Really looking forward to this – a big step towards opening new opportunities for us all.
Thank you, Tim!